
Dashboard
Overview is the first page you see after signing in, with a snapshot of sales, money owed and stock.
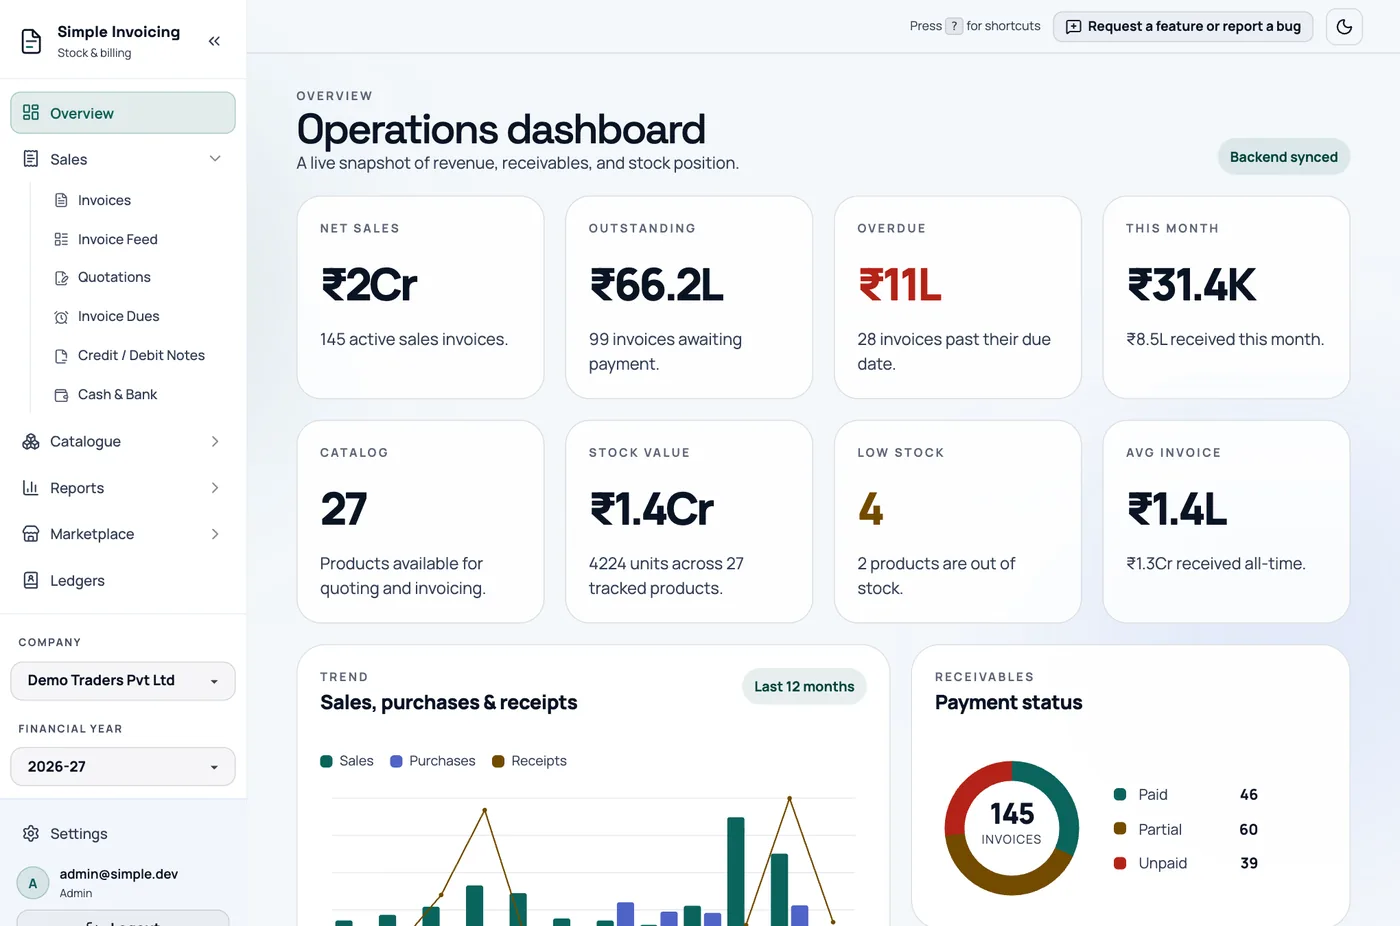
The dashboard has no date or financial-year filter. Figures cover all dates for the active company, except where the card says this month or last 12 months. Cancelled invoices are not counted.
The cards
| Card | What it shows | Click to open |
|---|---|---|
| Net sales | Total of all active sales invoices, including GST. Credit notes are not subtracted. | |
| Outstanding | What customers still owe on sales invoices. | Invoice Dues |
| Overdue | The part of that past its due date. Turns red when above zero. | Invoice Dues |
| This month | Sales invoiced since the 1st, and receipts this month. | |
| Catalog | How many products you have. | Products & Stock |
| Stock value | Quantity × purchase price, across stock-tracked products. | Products & Stock |
| Low stock | Products at or below their reorder level, and how many are out of stock. | Low stock list |
| Avg invoice | Total sales ÷ number of sales invoices. |
Large amounts are shortened, such as ₹66.2L. Hover over a figure for the full amount.
The panels
- Sales, purchases & receipts: a monthly chart for the last 12 months.
- Payment status: how many sales invoices are paid, part paid and unpaid.
- Inventory pressure points: the five tracked products with the least stock.
- Top products by revenue: your five best sellers.
- Latest activity: the six newest invoices. Click one to preview it.
For figures over a chosen period, use Analytics.