
Analytics
Reports → Analytics shows sales and product performance over any date range.
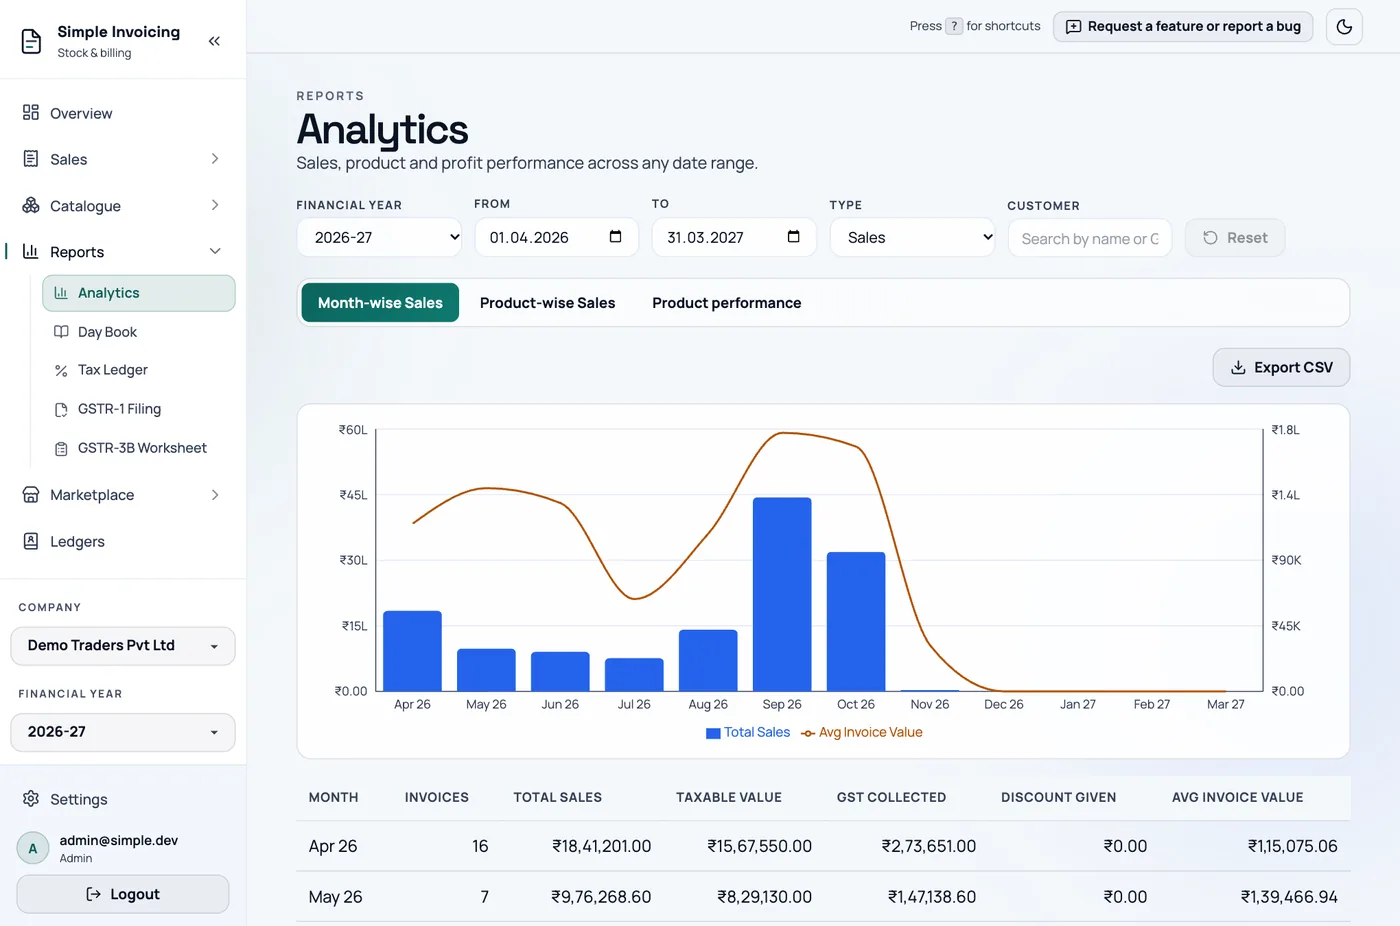
Filters
- Financial Year fills in the dates for you. Choose Custom range, or edit From and To, to set your own.
- Type switches between Sales and Purchase. It is not shown on the Product performance tab.
- Customer (Party on Product performance) narrows to one party. Product narrows to one product.
- Reset returns to the active financial year.
The tab and filters are kept in the page address, so you can bookmark a view or send the link to a colleague who has access. Cancelled invoices are not counted.
Month-wise Sales
A chart and a table of each month in the range: Invoices, Total Sales (with GST), Taxable Value, GST Collected, Discount Given and Avg Invoice Value. Use Export CSV to download the table.
The column names stay the same when Type is set to Purchase, so "Total Sales" then means total purchases.
Product-wise Sales
Lists each product sold, and you can export it as CSV. The chart toggles between Top 10 and Bottom 10, and By Revenue and By Quantity, independently of the table's sort.
Two of the amounts differ on purpose:
- Sales Amount excludes GST and is after all discounts.
- Total Revenue includes GST and is before invoice-level discounts.
Product performance
This is where you see profit. It shows sales and purchases of each product side by side, with returns. All money excludes GST.
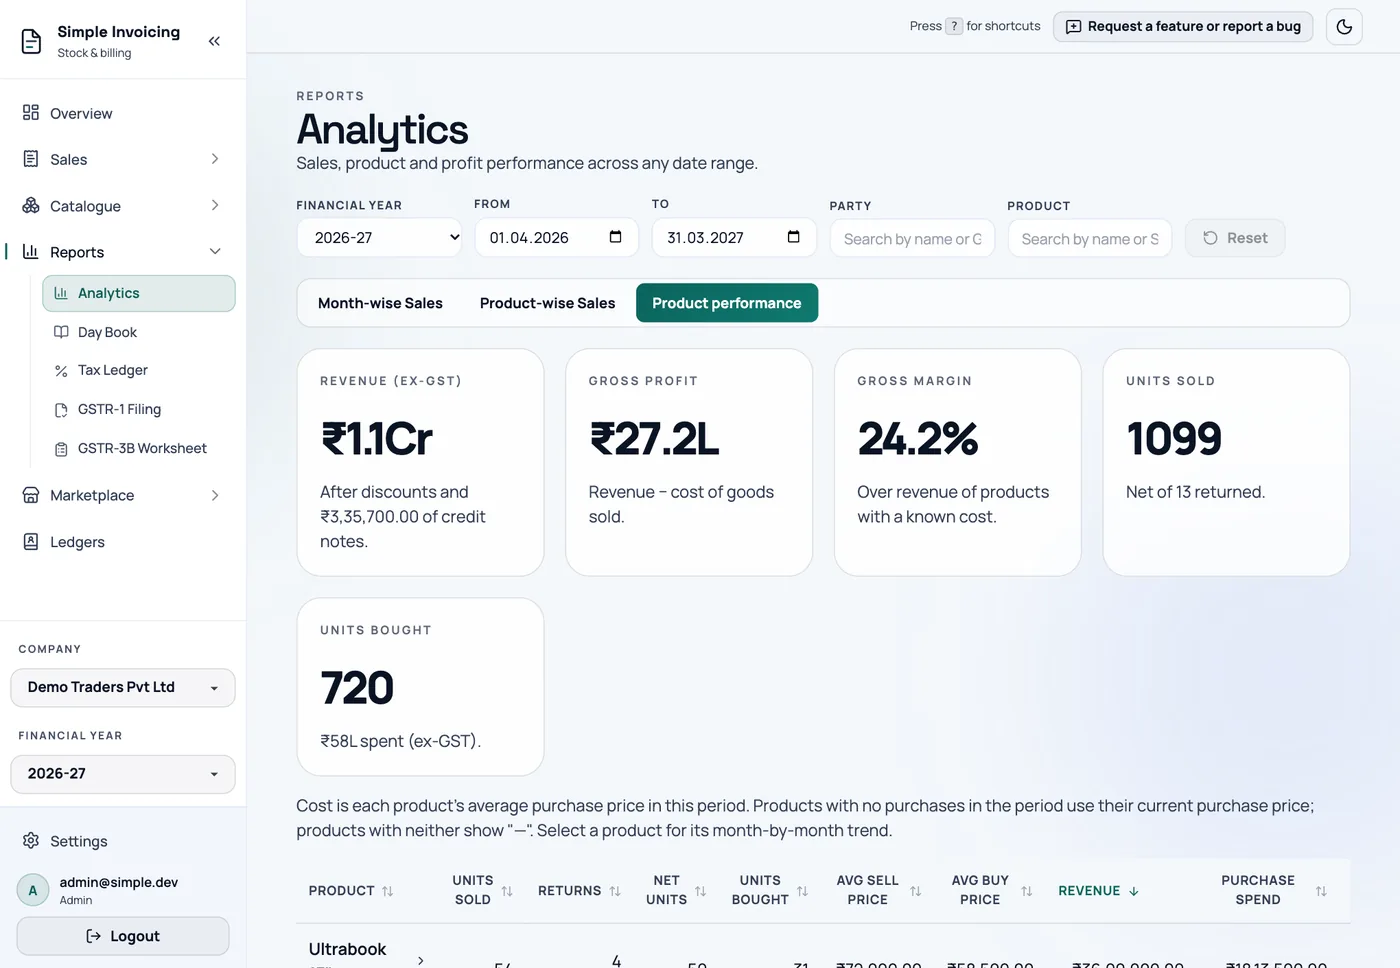
The summary cards show Revenue (ex-GST), Gross profit, Gross margin, Units sold and Units bought. Click a column heading to sort, and click a row to open that product's month-by-month page.
How profit is worked out
| Figure | Calculation |
|---|---|
| Revenue | Sales after discounts, less credit notes |
| Cost per unit | The average purchase price in this period, net of supplier credit notes |
| COGS (cost of goods sold) | Net units sold × cost per unit |
| Gross Profit | Revenue − COGS |
| Margin | Gross profit ÷ revenue |
- If a product had no purchases in the period, its current purchase price is used instead, and a current price badge shows on the row. Keep purchase prices up to date so this estimate stays useful.
- If a product has neither, its profit shows — rather than a misleading figure, and it is left out of the margin.
- Only return-type credit notes change unit counts. Discount and adjustment notes reduce value only.
This is gross profit
These figures do not include rent, salaries or other running costs, so this is not your net profit.
A single product's page
Click a product to see stock cover at the current sales pace, charts of units, revenue, profit and prices over time, and a Month by month table. Filtering to one party limits the units and money to that party, but the cost still reflects what you paid all suppliers.